An eye chart is a fundamental tool. It helps measure your visual acuity. This visual acuity test shows how sharply you see details. Understanding your visual acuity is vital for good eye health. Globally, at least 2.2 billion people experience either near or distance vision impairment. This simple test can help detect issues early. The annual global economic burden due to distance vision impairment from uncorrected refractive errors is estimated at US$202 billion. This blog will demystify this important visual assessment. You will understand this visual test, its types, and what your visual acuity results mean for your overall acuity.
Key Takeaways
An eye chart measures your visual acuity. This shows how clearly you see details. It is a key part of any eye exam.
The Snellen chart is the most common eye chart. It uses letters that get smaller. Specialized charts help children or people who cannot read.
Your visual acuity score, like 20/20, tells you about your vision. 20/20 means you see clearly at 20 feet. Other scores show if your vision is not as sharp.
Regular eye chart tests find vision problems early. This helps your eye doctor recommend glasses or other treatments. Early detection keeps your eyes healthy.
What is an Eye Chart: Defining Visual Acuity
An eye chart is a fundamental tool. You use it to measure the sharpness or clarity of your vision. This measurement is called visual acuity. Visual acuity tells you how well you see details and shapes from a specific distance. It is a key part of any comprehensive eye exam.
Purpose of Visual Acuity Measurement
Measuring your visual acuity is very important. It helps eye care professionals understand your eye health. A visual acuity test serves several critical purposes. First, it assesses the clarity of your central vision. This helps doctors see how well you perceive objects directly in front of you. Second, this test helps detect and monitor many different eye conditions. For example, doctors use it to identify refractive errors like nearsightedness, farsightedness, and astigmatism. They also use it to check for cataracts, diabetic retinopathy, and macular degeneration. These conditions can significantly affect your vision. The visual acuity test also helps identify amblyopia (lazy eye) and strabismus (crossed eyes). It can even detect optic neuritis, which causes sudden vision loss.
Furthermore, a visual acuity test establishes a standard baseline for your performance. This baseline helps track changes in your vision over time. Regular checks ensure early identification of vision impairment. This allows for timely intervention and treatment. Finally, visual acuity measurements fulfill important requirements. You need them for driving licenses, workplace evaluations, and school screenings. Most routine physical examinations also include this essential visual test.
Understanding Visual Acuity
So, what exactly is visual acuity? Visual acuity refers to the clarity or clearness of your vision. It measures how well you see. The word “acuity” comes from the Latin word “acuitas,” which means sharpness. Scientifically, visual acuity is the sharpness or clearness of your visual perception. Several factors influence this perception. These include your eye’s ability to focus light correctly. The condition of your retina, the light-sensitive tissue at the back of your eye, also plays a role. Finally, the normal functioning of your visual pathway and the processing centers in your brain are crucial.
When you take a visual acuity test, you are checking your ability to discern shapes and details at a given distance. A common measurement you might hear is “20/20 vision.” This indicates a specific clarity of vision at a certain distance. It means you see at 20 feet what a person with normal vision sees at 20 feet. Understanding your visual acuity helps you and your eye doctor maintain your eye health.
Types of Eye Charts for Visual Acuity Test
You will find different types of eye charts. Each one helps measure your visual acuity. Some charts are common. Others are for special needs.
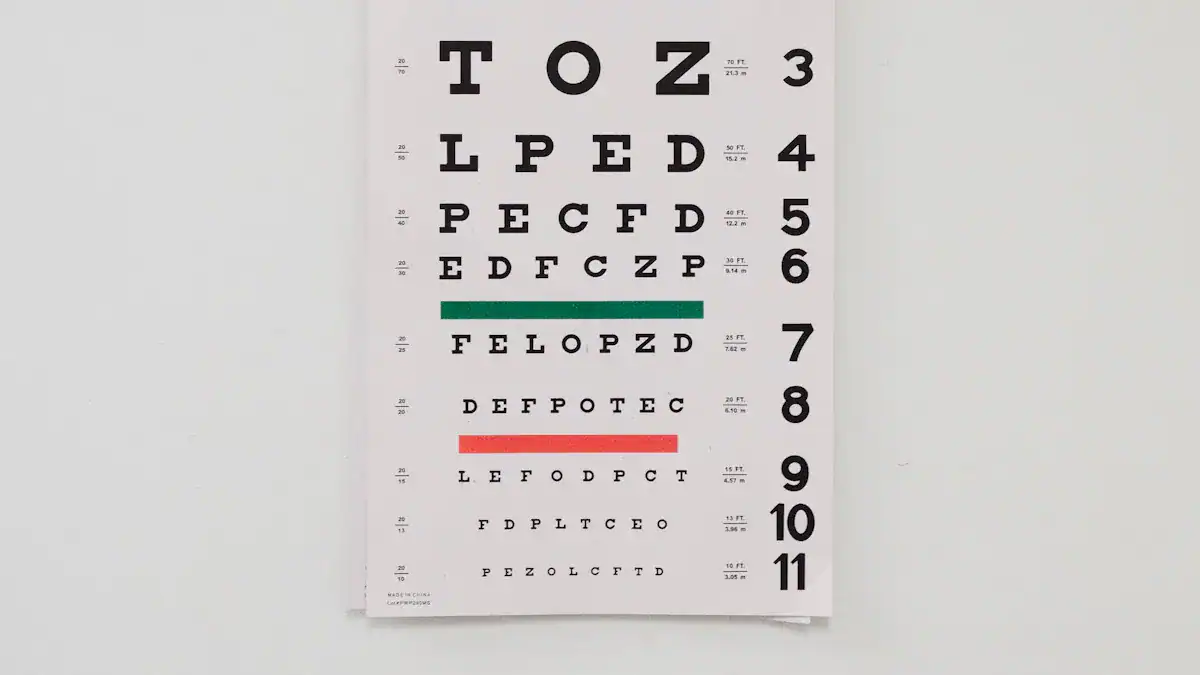
The Snellen Eye Chart
The Snellen eye chart is the most common visual acuity test. You probably recognize it. It features rows of letters. These letters get smaller as you read down the chart. An ophthalmologist named Herman Snellen developed this eye chart in 1862 in the Netherlands. His colleague, Dr. Franciscus Donders, used a chart for vision diagnosis. Snellen’s chart improved on this idea. It had letters organized proportionally. The letters decreased in size consistently. For example, 20/40 letters are twice the size of 20/20 letters. This design revolutionized eye care. It gave a standard way to test visual acuity. This consistency became very important as people traveled more and industries needed precise vision.
Snellen designed his charts using a 5×5 unit grid for symbols. He first used abstract symbols in 1861. But the charts published in 1862 used alphanumeric capital letters within this grid. He also created ‘The Tumbling E’ chart. This was for people who could not read, like children. This version used only the letter ‘E’. The ‘E’ pointed in different directions. You would show the ‘E’s direction with your fingers. This chart maintained the same geometric consistency. Herman Snellen also gave us the idea of ’20/20 vision’. This is the Snellen Ratio. It compares what you see at 20 feet to what an average person sees. For example, 20/10 vision means you see at 20 feet what most people need to be 10 feet away to see. A 20/200 vision means you are legally blind. You must be 20 feet away to see what most people see from 200 feet.
When you take a snellen eye test, the chart has specific features:
Attribute | Value |
|---|---|
Chart Size (Inches) | 24×11 in |
Chart Size (cm) | 60×38 cm |
Testing Distance | 6m / 20ft |
Optotype | SNELLEN |
Optotype Arrangement | Snellen Progression |
Contrast Level | High |
Finish | Non-reflecting, matte finish |
Design Principle | Subtended 5 minutes of arc with a 20 foot distance; 5×5 grid for optotypes |
This standard design ensures your visual acuity test results are reliable.
Specialized Eye Charts
Sometimes, a standard snellen eye test is not suitable. This is true for young children or people with certain disabilities. For these situations, eye doctors use specialized eye charts. These charts still measure visual acuity. They just do it in different ways.
For children, several options exist:
LEA symbols: These charts use simple shapes. You will see circles, squares, houses, and apples. Children can identify these figures easily. They do not need to know letters.
Allen figures: These are another set of pictures. They use familiar images.
HOTV optotypes: These charts simplify letters to just H, O, T, and V. These letters are distinct. Children who do not know their alphabet can match them to cards.
Here is a comparison of some methods for pediatric visual acuity testing:
Method | Description | Target Population | Pro | Cons | Ideal Use Case |
|---|---|---|---|---|---|
Snellen acuity | Chart with the alphabet | School-aged children; literate patients | Widely available, inexpensive, well established | Requires literacy/letter recognition, not suitable for young children | Standard acuity testing for literate children and adults |
LEA symbols | Chart with four simple symbols (circle, square, house, apple) | Toddlers, preschoolers; nonverbal patients | Standardized, validated, culturally neutral, easy to understand, can match | Limited symbol option may become boring | Screening and clinical testing for toddlers and preschoolers |
Allen pictures | Chart with familiar images (e.g., house, hand) | Young children | Recognizable, engaging for kids from variety of images, can match | Poor standardization, outdated images, high variability, difficult to see beyond 20/40 | Use when LEA Symbols are not available or unable |
Teller acuity cards | High-contrast black-and-white stripes of varying spatial frequencies | Young children and nonverbal patients | Can be used on anyone, easy to administer, patients naturally look towards stripes | Can take a long time, subjective interpretation variability, patients can get bored or distracted, underestimates visual acuity, expensive | N/A |
For adults, especially in research, you might encounter the ETDRS chart. ETDRS stands for Early Treatment Diabetic Retinopathy Study. This visual acuity test is more precise than the Snellen chart. It is often required by the FDA for clinical trials.
Here are some advantages of ETDRS charts:
ETDRS charts have an equal number of characters per row. Snellen charts vary from 1-8 characters.
ETDRS charts feature an equal logarithmic decrease between rows. Snellen charts have inconsistent letter size decreases.
ETDRS charts use character types with uniform legibility. Not all characters on Snellen charts are equally legible.
This chart shows how ETDRS charts offer better accuracy and reproducibility for your visual assessment:
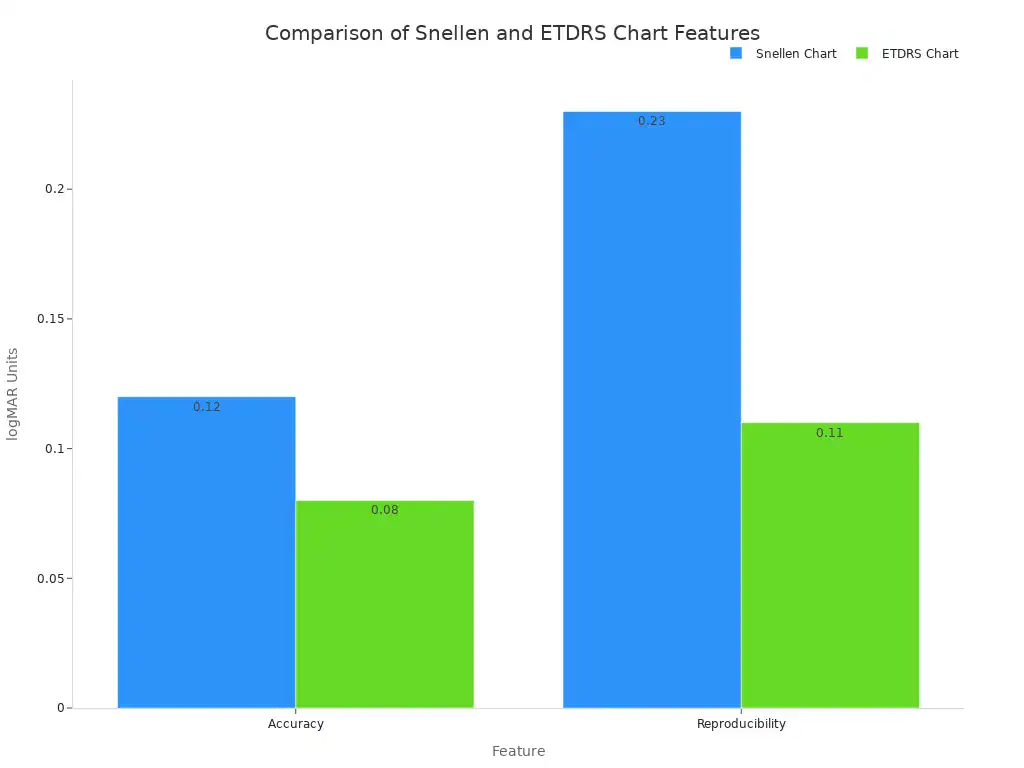
ETDRS charts provide more precise measurements. This is especially true for low visual acuity. They can measure acuity between 20/100 and 20/200 lines. Snellen charts typically do not measure this range.
How the Eye Chart Test Works
You might wonder what happens during a visual acuity test. This test is a straightforward process. It helps your eye doctor understand how clearly you see. You will follow specific steps to get accurate results.
Test Setup and Distance
The setup for a visual acuity test is quite simple. Your eye doctor places the eye chart at a specific distance from you. This distance is very important for accurate measurement. The standard testing distance for visual acuity charts is typically 20 feet. This is the same as 6 meters. You sit or stand at this exact distance from the chart. This ensures the test measures your vision correctly.
Proper lighting is also crucial for an accurate test. The room needs to be well-lit. This helps your eyes function optimally. The International Council of Ophthalmology (ICO) suggests an illumination level for the visual acuity chart between 80 to 320 lux. This range is similar to a well-lit office. It helps you see clearly without glare or discomfort. For the best results, the object you view must have standardized illumination. The testing room should be brightly lit. This allows clear vision and helps your cone photoreceptors work their best. A luminance level for acuity testing equal to or higher than 85 candelas per square meter is recommended. However, you should avoid too much brightness to prevent glare.
Here are some recommended lighting conditions for vision testing rooms:
Type of area or task | Maintained illuminance (lx) |
|---|---|
Vision testing rooms | 500 |
Reading and colour vision tests with vision charts | 500 |
Monocular and Binocular Testing
During the visual acuity test, your eye doctor will test each eye separately. This is called monocular testing. You will cover one eye, usually with an occluder or your hand. Then, you read the smallest line of letters or symbols you can see on the eye chart with your uncovered eye. Your doctor will ask you to read from the top of the chart down. The letters get smaller as you go down. You repeat this process for your other eye.
After testing each eye alone, your doctor will test both eyes together. This is called binocular testing. You will keep both eyes open and read the chart again. This part of the visual acuity test gives a more complete picture of your overall visual capability. Studies show that binocular visual resolution can be about 13% greater than the average of your individual eye scores. This means testing both eyes together provides valuable information.
Both monocular and binocular visual acuity measurements are key parts of any eye exam. They are crucial for proper clinical care and record keeping. While your better eye often predicts your binocular acuity for tasks like reading, assessing both eyes is still important.
For example, in people with age-related macular degeneration (AMD), the eye with worse vision can affect daily activities more than the better eye. This shows you should not ignore the worse-vision eye. Binocular acuity models also account for more differences in vision-related quality of life scores compared to just monocular acuity. This means binocular testing gives a more complete measure of how well you function visually. Using only monocular acuity might underestimate how much vision loss affects your daily life. Binocular acuity is often more important for performing daily activities because you use both eyes most of the time.
Sometimes, you might see a big difference between your monocular and binocular visual acuity scores. This can have implications for your vision.
A larger difference between your eyes can reduce how well your eyes work together. This is especially true when you look at things with low contrast.
When your eyes work well together for low-contrast vision, you often report a better quality of life related to your vision.
Your binocular acuity scores are closely related to the average score of both your eyes.
Binocular acuity is often a better indicator of your ability to do daily tasks that require vision. This is because you typically use both eyes in everyday life.
The smallest line you can read clearly on the eye chart determines your visual acuity. Your doctor will record this score for each eye and for both eyes together. This helps them understand your vision health.
Understanding Eye Chart Results
You have completed your visual acuity test. Now, you need to understand what the numbers mean. Your eye doctor will give you a score like 20/20 or 20/40. These numbers tell you about your vision sharpness. They show how well you see details from a specific distance.
Decoding 20/20 Vision
Many people consider 20/20 vision perfect. This score means you see at 20 feet what a person with normal vision sees at 20 feet. It is a benchmark for clear sight. Specifically, 20/20 vision means you can resolve a letter that subtends a 5-minute arc when you view it from 20 feet away.
The smallest detail within that letter you can resolve is 1 arc minute. This 1 arc minute resolution is the limit. Objects closer than 1 arc minute apart appear as one blurred object. This standard is typically assessed using an eye chart at a distance of 20 feet. Interestingly, only about 35% of adults achieve 20/20 vision without glasses, contact lenses, or surgery. This figure comes from data at the University of Iowa Hospitals & Clinics.
Interpreting Other Visual Acuity Scores
Your visual acuity test might show other scores. These scores tell you about your visual sharpness. For example, 20/40 vision means you must be 20 feet away to see what a person with normal vision sees from 40 feet. This indicates your vision is not as sharp. Common visual impairments linked to 20/40 vision include refractive errors. These errors happen when your eye’s shape changes how light passes through. Examples are nearsightedness, farsightedness, and astigmatism. Presbyopia, an age-related condition, also contributes to 20/40 vision. Eye conditions like cataracts or digital eye strain can also cause this.
Other scores indicate more significant vision impairment. For instance, 20/200 vision means you must be 20 feet away to see what a person with normal vision sees from 200 feet. This score is important for legal definitions. In the United States, legal blindness means a visual acuity of 20/200 or less in your better-seeing eye, even with correction. This means you can only read the top ‘E’ line of an eye chart from 20 feet away.
Here is a general guide to visual impairment levels:
Visual Impairment Level | Visual Acuity (Snellen) |
|---|---|
Normal | 20/10-20/25 |
Near Normal | 20/30-20/60 |
Moderate | 20/70-20/160 |
Severe | 20/200-20/400 |
This table helps you understand what your eye chart results mean for your overall vision.
Importance of Visual Acuity Testing
A regular visual acuity test is very important for your eye health. This simple test helps you understand your vision. It plays a big role in keeping your eyes healthy.
Detecting Vision Problems Early
Your visual acuity test helps identify many vision problems early. This is crucial for timely treatment. The test can detect common refractive errors. These include nearsightedness (myopia), farsightedness (hyperopia), astigmatism, and presbyopia. These conditions affect how your eyes focus light. For example, a visual acuity test is the first step in diagnosing these issues. Early detection means you can get help sooner. This helps prevent your vision from getting worse. The test also monitors other eye health conditions. It tracks changes in your visual clarity over time. This helps your eye doctor catch problems like cataracts or glaucoma before they become severe.
Guiding Corrective Measures
The results from your visual acuity test guide your eye doctor. They use this information to recommend the best corrective measures for your vision. If you have a refractive error, you might need glasses or contact lenses. These are common and straightforward ways to correct your vision. Eyeglasses compensate for light focusing issues. Contact lenses sit directly on your eye. They offer a natural visual experience.
For some, refractive surgery is a more permanent solution. This type of surgery adjusts the shape of your cornea. LASIK is a common refractive surgery. It reshapes the cornea with a laser. Other procedures include PRK and RLE. These surgeries can correct issues like myopia, hyperopia, or astigmatism. For example, historical data shows that over 90% of people who undergo LASIK achieve 20/20 vision or better. Your visual acuity score helps determine if these options are right for you. This test ensures you receive the most effective treatment for your specific visual needs.
Eye charts are simple tools. They are profoundly important for assessing and maintaining your eye health. You now understand what visual acuity means. This knowledge is a proactive step towards better overall well-being. It helps you take charge of your vision. Schedule regular comprehensive eye exams with a qualified eye care professional. Protect your vision for years to come.
FAQ
What is an eye chart’s main purpose?
An eye chart measures your visual acuity. This tells you how sharply you see details. Doctors use it to check your vision clarity. It helps identify if you need glasses or have eye problems.
What does 20/20 vision mean?
20/20 vision means you see clearly at 20 feet. A person with normal vision also sees clearly at 20 feet. It is a benchmark for excellent sight. You can resolve fine details at that distance.
What are the most common types of eye charts?
The Snellen chart is the most common. It uses rows of letters that get smaller. For children, doctors use LEA symbols or HOTV charts. These charts use pictures or simple letters.
What does it mean if your vision is not 20/20?
If your vision is not 20/20, you may have a refractive error. This means your eye does not focus light perfectly. You might need glasses or contact lenses. Your eye doctor can help correct this.